Profile Page: enter your personal information.
Setting page: Set default metrics and startup tab, check help messages and information about the TiY.
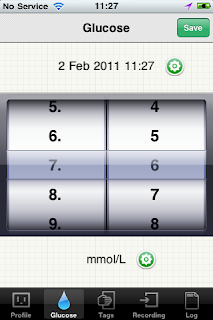
Glucose page: input glucose readings and attach contextualized information (Pictures, Notes, Insulin intakes as well as Patient-generated Tags).
Tag editor: create personal tags (define whether the tag should be countable or not, set its maximun and minimum value, the level of decimals, the unit of measure (among a comprehensive set of available metrics), choose an icon and a color).
Log page: review, search, and sort (by date, attachment and category) all entries.
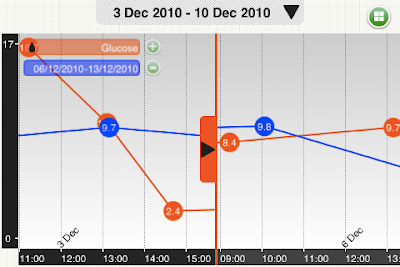
Graphical visualization of the log
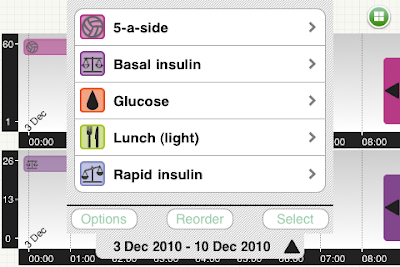
Select and reorder: chose what data you waant to display and in which order.
Dynamic and interactive visualizations: visualize what you need and look for meaningful patterns or correlations. Split the screen into two independently scrollable parts to improve data comparison between different period of time.
Track your personal activities (e.g. 60 minutes of '5-a-side') and see how they affect the level of sugar.
Overlap different periods of time of the same type of data to further improve searching for meaningful patterns and correlations.


